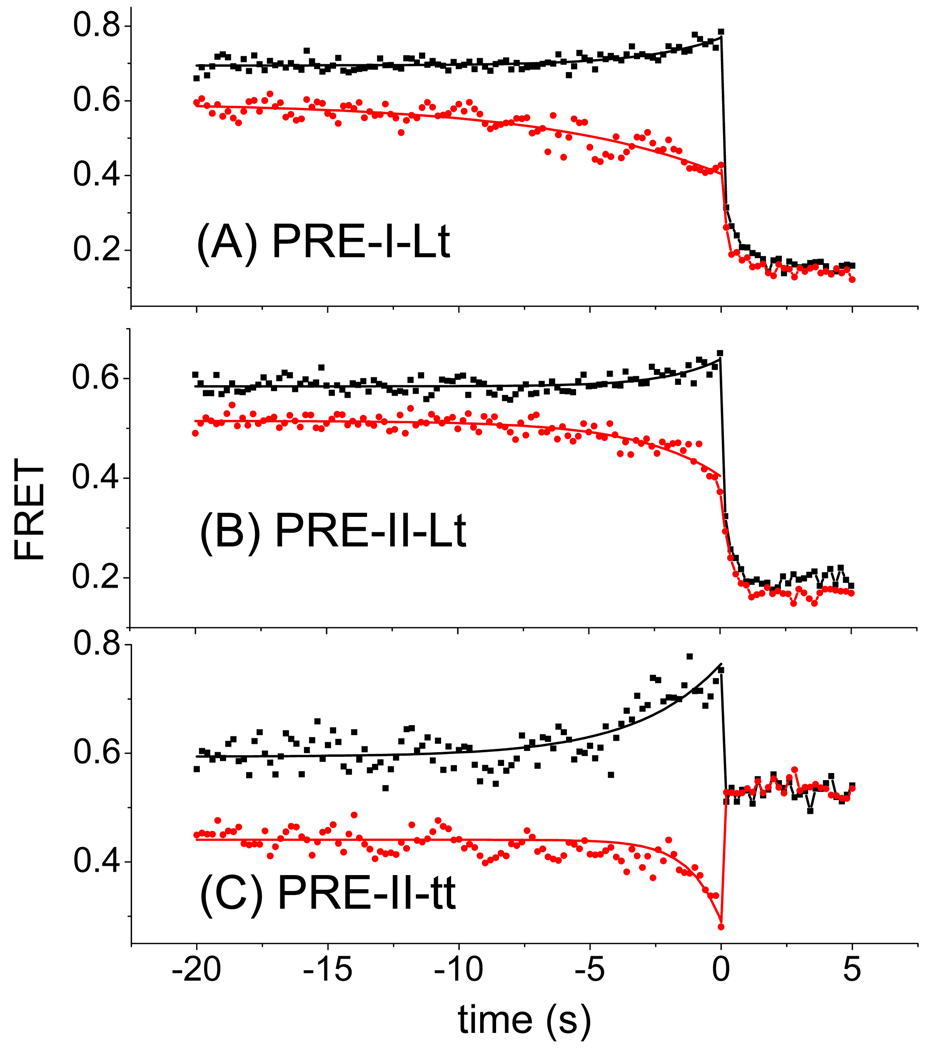
Figure 4. Post-synchronized, averaged translocation traces of fluctuating PRE complexes translocated from high FRET (black squares) and low FRET (red circles) PRE states.
A: PRE-I(Lt) B: PRE-II(Lt) C: PRE(II-tt). Average FRET values as a function of time were calculated by post-synchronizing all translocation events to the time (t = 0) of maximum FRET change. The solid curves are fits of the equation E = Eo + ΔE (1 − ekt) to the results from t = 0 s to t = −20 s, where E is the average FRET value as a function of time, Eo is the FRET value at t = 0, Eo + ΔE is the asymptotic FRET value at large negative time, and k is the apparent rate constant k’b.

