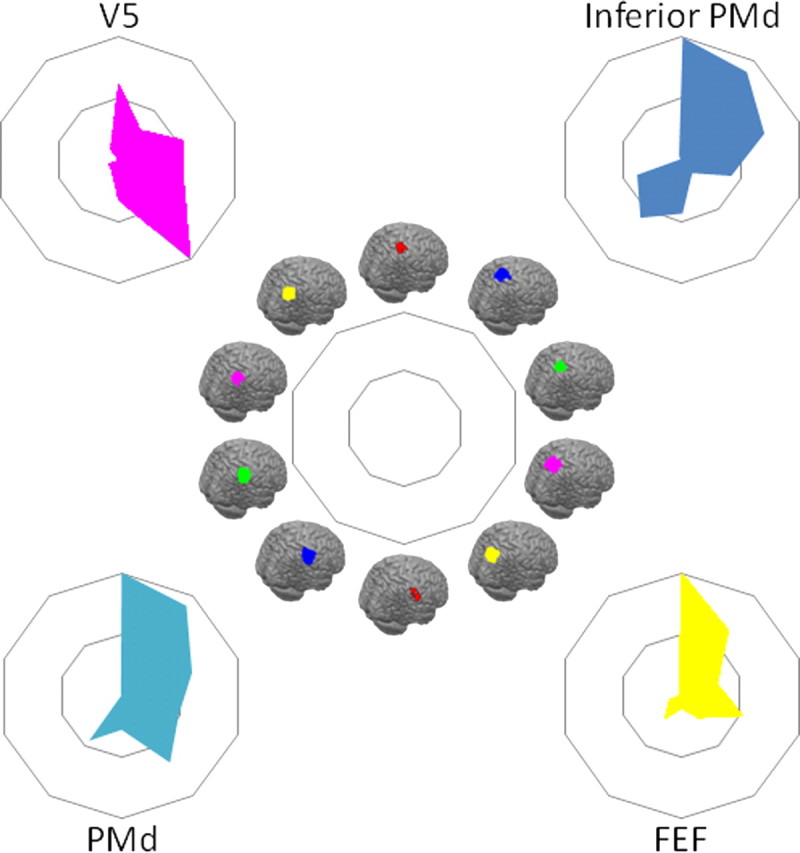
Figure 10.

Comparison of tractography-based parcellation and human resting-state results for target areas hypothesized to interact strongly with the SPL. Connectivity fingerprints indicating the relative overlap between z-statistical images and the IPL clusters from the tractography-based parcellation shown in Figure 2 and the SPL parcellation shown in Figure 7, ranging from the most anterolateral SPL cluster (top of spider plot) clockwise to the most posterior SPL cluster and then from the most anterior IPL cluster (bottom of spider plot) to the most posterior IPL cluster. Connectivity fingerprints are from V5 (magenta), inferior PMd (blue), PMd (cyan), and FEF (yellow). Data are normalized to reflect the relative contribution of each target area.
