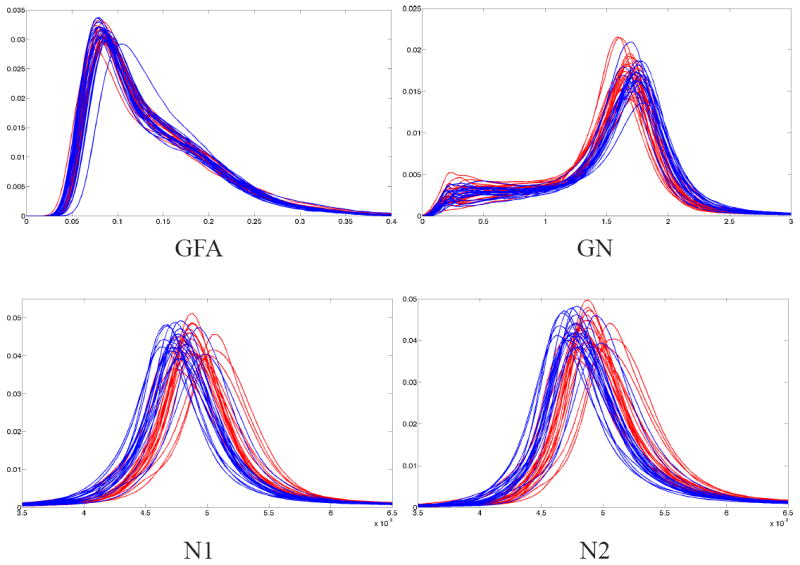
Fig. 1.

PDF’s of diffusion measures for 21 FE patients (red) and 20 NC (blue). Top row: GFA and GN are shown, but only GN was chosen as biomarker for the SH model. Bottom: Norms of both the tensors in F2T model show significant difference between the groups.
