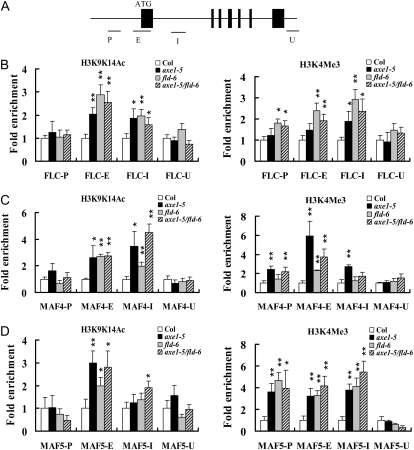
Figure 3.
Levels of H3K9K14Ac and H3K4Me3 in FLC, MAF4, and MAF5 chromatin. A, Schematic structure of genomic sequences of FLC, MAF4, and MAF5 and the regions examined by ChIP. FLC, MAF4, and MAF5 have a similar genomic structure, and black boxes represent exons. B to D, Relative levels of H3K9K14Ac and H3K4Me3 in FLC (B), MAF4 (C), and MAF5 (D) in Col, axe1-5, fld-6, and axe1-5/fld-6 seedlings grown under LD conditions for 10 d. The amounts of DNA after ChIP were quantified and normalized to an internal control (ACTIN2). The fold enrichments of axe1-5, fld-6, and axe1-5/fld-6 over Col at the indicated regions are shown. The values shown are means ± sd. * P < 0.05, ** P < 0.01.

