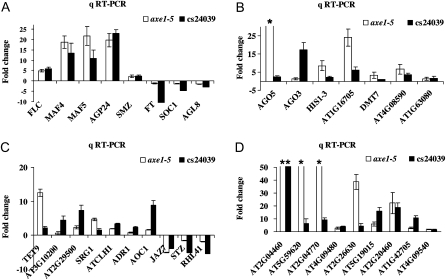
Figure 7.
Validation of the DNA microarray data. qRT-PCR analysis of the gene expression involved in flowering (A), gene silencing (B), stress (C), and transposons (D) is shown. Total RNA was isolated from Ws, HDA6-RNAi (cs24039), Col, and axe1-5 plants grown in SD conditions. The values shown are relative fold changes compared with Col (for axe1-5) or Ws (for HDA6-RNAi) with sd. * The fold change was higher than 20.

