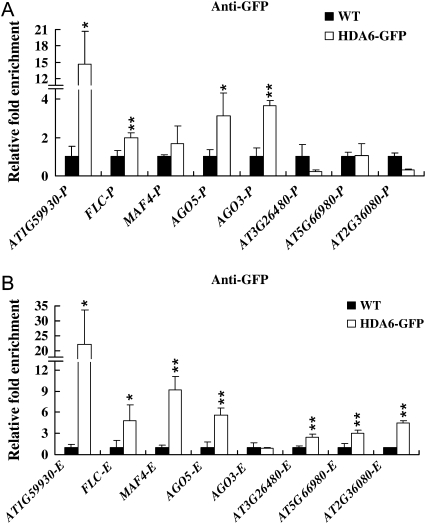
Figure 8.
Target genes of HDA6 identified by ChIP followed by real-time PCR analysis. Transgenic plants expressing HDA6-GFP were subjected to ChIP analysis using an anti-GFP antibody. Wild-type (WT) plants were used as negative controls. The relative fold enrichment of a target in the promoter (A) and transcription start site (B) was calculated by dividing the amount of DNA immunoprecipitated from HDA6-GFP transgenic plants by that from the negative control plants and compared with input DNA. * P < 0.05, ** P < 0.01.

