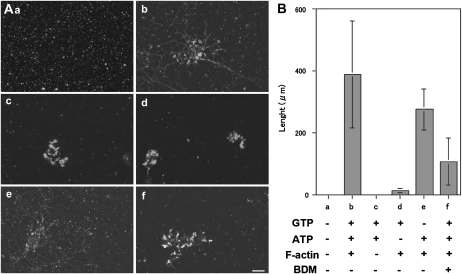
Figure 5.
ER tubule formation in the S12 fraction (A) and the length of ER tubules (B). A, Images taken 50 min after each treatment: a, only S12 fraction; b, S12 fraction with 2 mm ATP, 0.5 mm GTP, and 2.5 μg mL−1 F-actin; c, S12 fraction with ATP and GTP but not F-actin; d, S12 fraction with GTP and F-actin but not ATP; e, S12 fraction with ATP and F-actin but not GTP; f, S12 fraction in the presence of 50 mm BDM with ATP, GTP, and F-actin. Bar = 10 μm. B, Length of ER tubules after 50 min under the same conditions as described in A. Means ± sd from three separate experiments are plotted.

