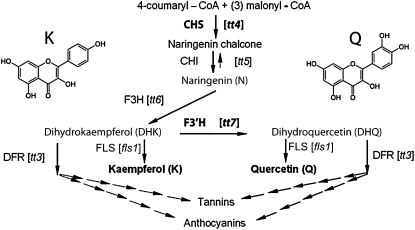
Figure 1.
The flavonoid biosynthetic pathway. Intermediate compounds and enzymes in the pathway are shown with mutant alleles represented in brackets. The structures of naringenin and quercetin are shown, and downstream products are represented at the bottom of the diagram. Enzymes, mutants, and metabolites central to this study are shown in boldface. This figure is modified from Buer and Muday (2004).

