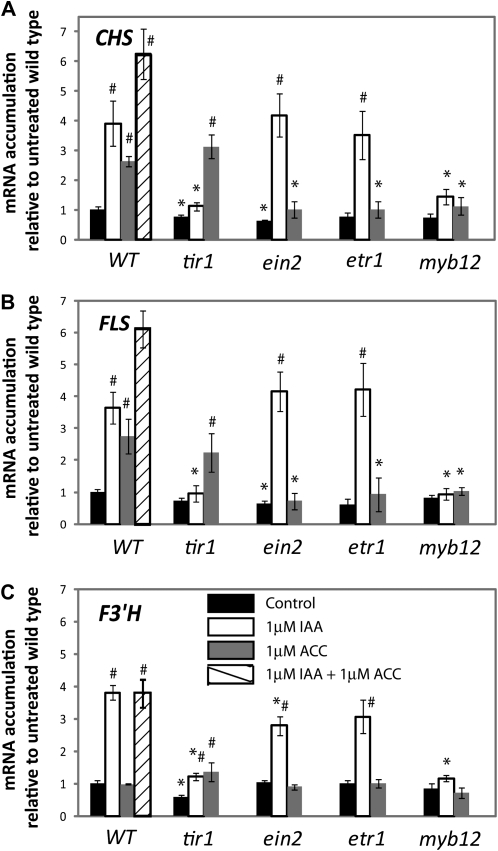
Figure 2.
IAA and ACC enhance the expression of genes encoding flavonol pathway enzymes. The abundance of CHS, FLS, and F3′H transcripts relative to actin and normalized to the untreated wild type (WT) 6 h after treatment with 1 μm IAA and ACC is shown in the wild type, tir1, ein2, etr1, and myb12. The basal level and fold induction of CHS (A), FLS (B), and F3′H (C) transcript abundance after treatment with IAA and ACC are shown in all genotypes. Mean and se of three biological replicates are shown. * Significant difference (P < 0.05) between the mutant and the wild type within a treatment; # significant difference between treated and untreated controls within a genotype as determined by Student’s t test (P < 0.05).

