Figure 3.
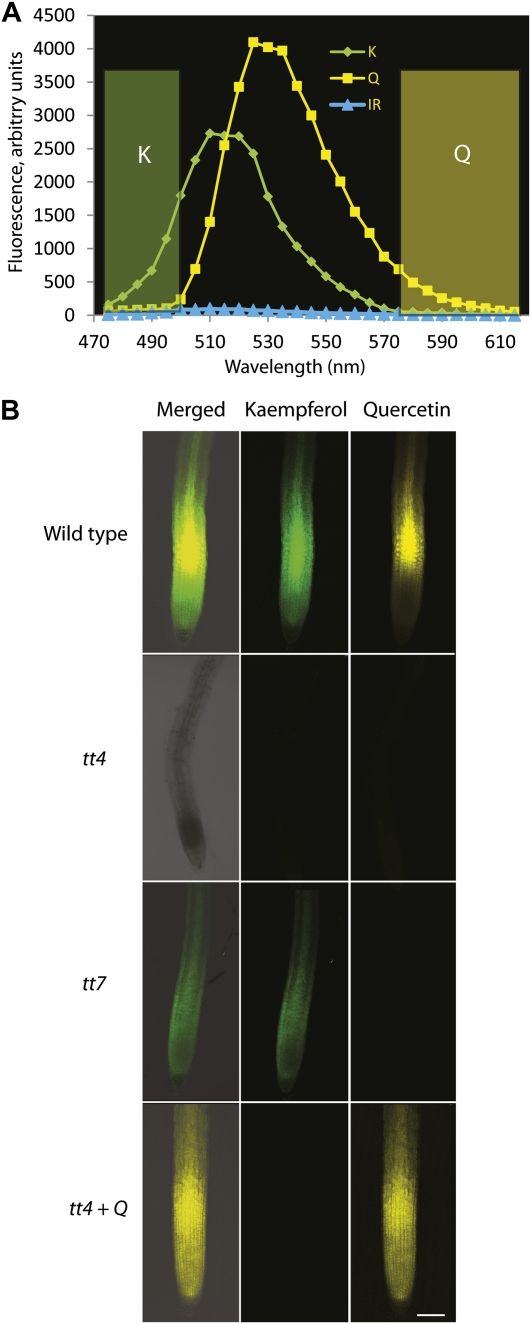
Determination and validation of LSCM settings for kaempferol and quercetin measurement. A, Graph of the emission spectra for kaempferol (K), quercetin (Q), and isorhamnetin (IR) acquired with tt7-2 roots as well as isorhamnetin- and quercetin-fed tt4-2 roots, with the wavelength range used for K-DPBA collection shaded in green and the Q-DPBA collection window in gold. B, Confocal micrographs of 6-d-old DPBA-stained wild-type, tt4-2, tt7-2, and tt4-2 primary roots 6 h after treatment with 10 μm quercetin illustrate the specificity of these settings for detecting only K-DPBA in green or Q-DPBA in yellow. Bar = 100 μm.

