Figure 4.
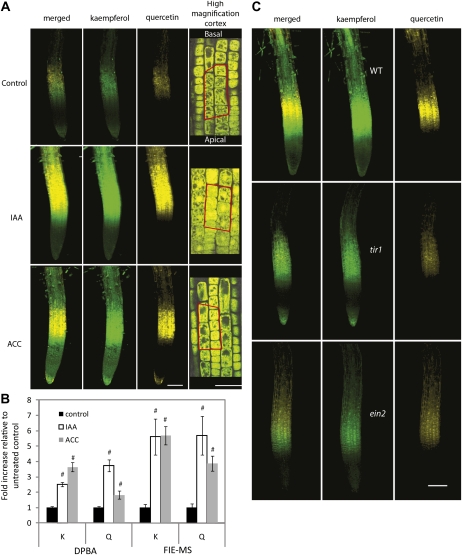
IAA and ACC increase flavonoid accumulation in primary roots and alter the distribution of these metabolites. A, Representative images of primary roots stained with DPBA 8 h after mock treatment or exposure to 1 μm IAA or 1 μm ACC. K-DPBA- and Q-DPBA-specific signals were collected, pseudocolored, and displayed as individual channels and an overlay. The right column shows higher magnification images that were used for quantification in the area defined by the red box, which contains seven cells. Mock-, IAA-, and ACC-treated roots are shown in rows one to three, respectively. Bar in left three columns = 100 μm; bar in right column = 50 μm. B, Comparison of DPBA and FIE-MS analyses of flavonoid accumulation in primary root tips in the elongation zone (DPBA) or in 5-mm root tips containing the elongation zone and an additional 4 mm (FIE-MS) after treatment with IAA and ACC. The two methods show a similar increase in flavonol accumulation 12 h after hormone treatment. # Significant difference between treated and untreated controls within a metabolite as determined by Student’s t test (P < 0.05). C, Six-day-old DPBA-stained wild-type, tir1-1, and ein2-5 primary roots. Representative images are from three separate analyses, each of which consisted of more than five micrographs each per genotype taken with identical gain and laser intensity. Gain settings were increased relative to A to better visualize DPBA staining in tir1-1 and ein2-5. Bar = 100 μm.

