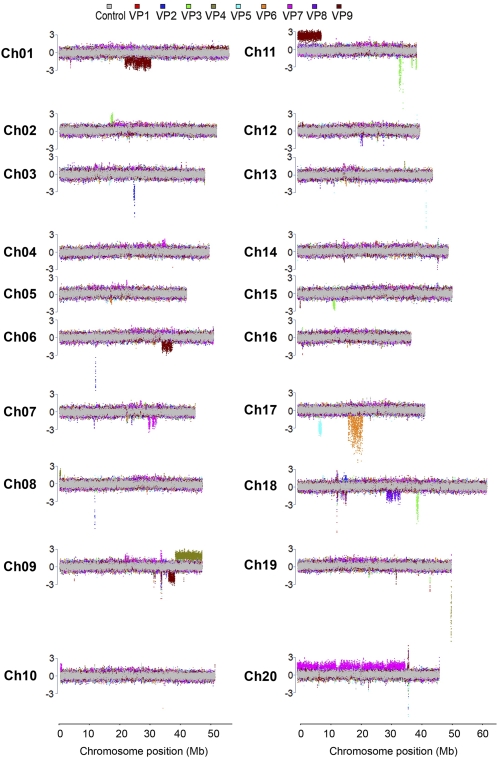
Figure 4.
CNV events detected by CGH in soybean FN visual phenotype mutants. Full chromosome views of CNV events are depicted for all 20 soybean chromosomes. The normalized log2 ratios of sample to control data are plotted as the median across 11 probe data points across chromosome positions. Results from each array are color coded for mutants VP1 through VP9. VP1 and VP2, short trichomes; VP3, chimeric leaf pigmentation; VP4, petite and yellow leaf; VP5, short petiole and crinkled leaf; VP6, copper leaf; VP7, abnormal floral meristem development; VP8, fused trifoliates; VP9, thick, twisted petioles. The gray overlay represents CGH data from control versus control CGH. Colored regions above and below the control regions potentially represent copy number change differences. The y axis scale is in terms of the number of sd from average, with the segment threshold for deletions or duplications at ±3.

