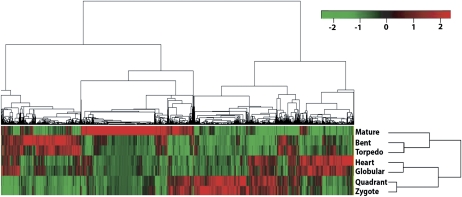
Figure 2.
. Hierarchical cluster analysis of gene expression patterns in Arabidopsis embryo development. Microarray analysis of seven embryo developmental stages identified 10,409 (shown in the top tree) differentially expressed genes at one or more stages referred to as modulated genes. We identified sets of modulated genes for each transition stage (namely, Z → Q, Q → G, G → H, H → T, T → B, B → M) using Limma software, then extracted their corresponding gene expression values for all seven stages (using single-channel normalization of Limma, see “Materials and Methods”). Z scores (statistical measure) were calculated for each of these genes and then used for hierarchical clustering. The analyses clustered Z and Q stages as phase I, G and H as phase II, T and B as phase III, and M stage as a distinct phase IV. Red indicates up-regulated genes whereas green indicates down-regulated genes. Scale bar represents fold change (log2 value).

