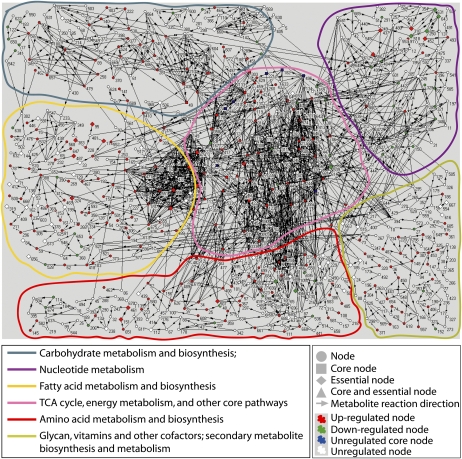
Figure 6.
Illustration of the dynamic metabolic network for torpedo-bent stages of Arabidopsis embryo development. The network model was generated in Pajek using the microarray data sets and KEGG database (Supplemental Table S6; “Materials and Methods”). Numbers represent the metabolites and the lines (with arrows) that connect the metabolites represent the genes encoding enzymes that catalyze their reactions (Supplemental Table S6). The pathways that represent six key biochemical reactions for carbohydrates, nucleotides, fatty acids, tricarboxylic acid cycle, amino acids, and vitamins are outlined in color (details in the bottom left box; see Supplemental Fig. S6 for metabolic networks of other embryo stages).

