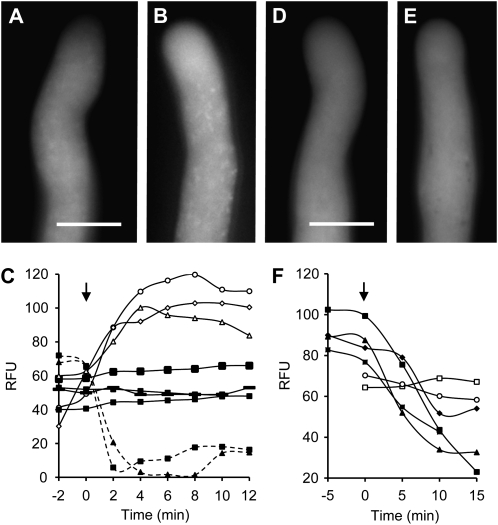
Figure 1.
ROS and NO distribution and verification in normally growing Papaver pollen tubes. A and B, Typical representative untreated, normally growing Papaver pollen tubes labeled with CM-H2DCF-DA to monitor ROS by formation of fluorescent CM-DCF. Bar = 10 μm. C, Quantification of CM-DCF fluorescence in normally growing untreated pollen tubes (black symbols and solid lines). The signal remains relatively stable over the time course. After addition of 2.5 mm H2O2 (arrow), CM-DCF fluorescence (white symbols, solid lines) increased. After addition of 200 μm DPI (arrow), CM-DCF fluorescence decreased (black symbols, dashed lines). Measurements are of relative fluorescence units (RFU) measured in individual pollen tubes. D and E, Typical representative untreated, normally growing Papaver pollen tubes labeled with DAF-FM-DA to monitor NO by formation of fluorescent DAF-FM-T. Bar = 10 μm. F, Quantification (in relative fluorescence units) of DAF-FM-T fluorescence in untreated pollen tubes (white symbols) and after addition of 400 μm cPTIO (black symbols).

