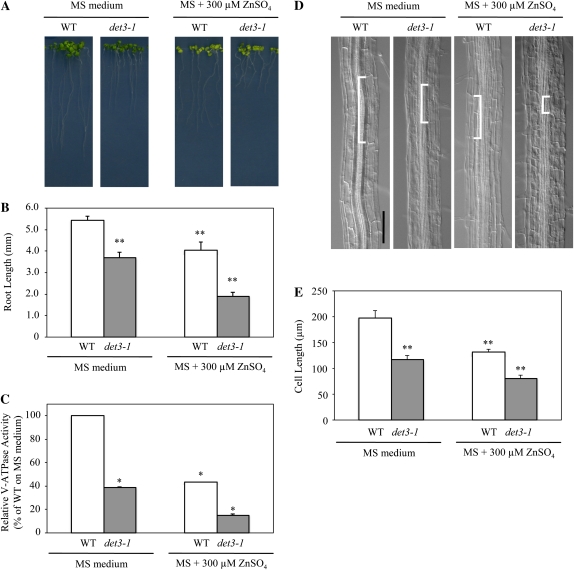
Figure 3.
Effects of excess zinc on phenotype of the det3-1 mutant. A and B, Wild-type (WT) and det3-1 mutant seedling growth (A) and root length (B) were measured. The sd values give an estimate of the variation in mean number of more than 10 plants. C, V-ATPase activity of microsomes from roots. Data are means ± sd of four independent experiments. About 1,200 seedlings were grown on 12 plates in each experiment at different times. D, Morphology of root cells in the wild type and the det3-1 mutant. White brackets show one cell in each root. Bar = 100 μm. E, Cell length in roots was measured at the cell maturation zone. The sd values give an estimate of the variation in mean cell length of more than 80 cells for each condition. About 200 seedlings were grown on two plates in parallel experiments. * P < 0.05, ** P < 0.001, significantly different from the wild type on MS medium.

