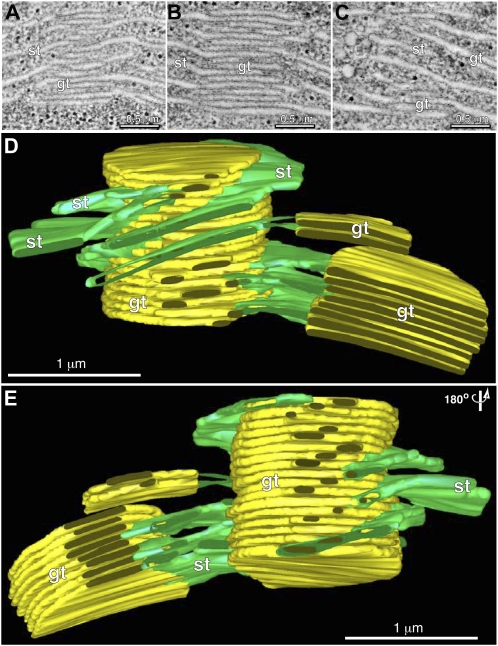
Figure 2.
An overview of grana and stroma thylakoid organization. A to C are three composite tomographic slice images (five superimposed 2.2-nm optical slices) showing views from the front (A), middle (B), and back (C) of a grana thylakoid stack. D and E are tomographic reconstructed models of the grana stack shown in A to C, with the grana thylakoids colored yellow and the stroma thylakoids colored green. Front view in D, and the model (E) is rotated 180° to show the back view. Note that for illustrative purposes the model does not display all of the thylakoids associated with the grana stacks.

