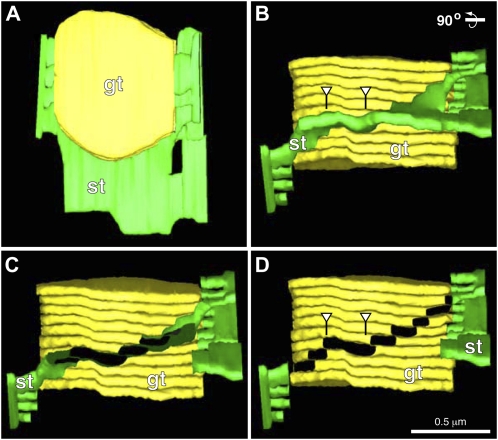
Figure 6.
Spatial distribution of differently sized grana-stroma connections on a grana stack. A is a tomographic model showing the top view of a grana stack (gt), with interconnected stroma thylakoids (st). B is a rotated (90°) tomographic model of A. C is a tomographic model of B where the stroma thylakoid has been partially cut away to reveal the connection site between the stroma and grana membranes (highlighted black). D is a tomographic model in which all of the stroma thylakoid membrane on the front side of the grana stack have been removed, revealing all of the stroma-grana connecting sites (highlighted in black). Note the white arrowheads pointing to a stroma-grana connecting site that is much longer than the others.

