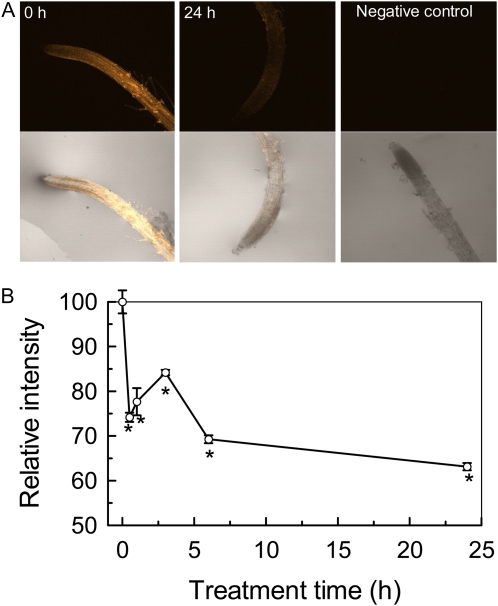
Figure 7.
Effect of Al on XET activity. Plants were grown on plates containing 50 μm Al for different times. Roots were subjected to cytochemical assays of XET activity (for details, see “Materials and Methods”). A, Images of XET activity shown as orange fluorescence in representative roots after 0 or 24 h of treatment with 50 μm Al and a negative control assay without xyloglucans. The top and bottom rows represent fluorescence images and merged images, respectively. B, Time course of XET activity changes expressed as relative fluorescence in response to Al stress. Data are means ± sd (n = 7). * Significant difference at P < 0.05.

