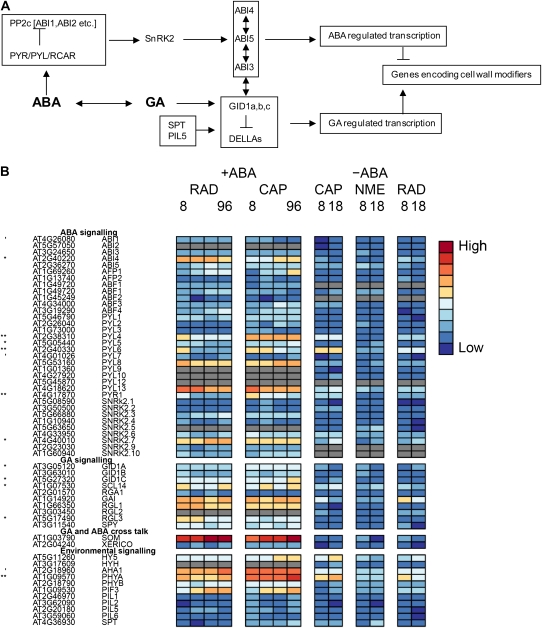
Figure 4.
Hormone signaling in Lepidium during CAP weakening. A, Schematic to illustrate ABA and GA signaling pathways. B, Heat maps showing the relative abundance of transcripts from genes involved in ABA, GA, and environmental signaling. ′, *, and ** indicate that transcript numbers are significantly different between the tissues on +ABA arrays at P < 0.1, P < 0.05, and P < 0.01, respectively. Genes not present in the data sets are colored gray.

