Figure 2.
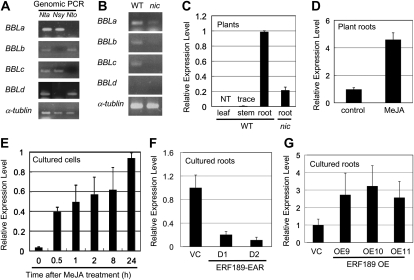
Expression profiles of tobacco BBL genes. A and B, PCR primers specific to each BBL member were used, and the tobacco α-Tubulin gene was amplified as a control. A, Genomic PCR analysis of N. tabacum (Nta) and its probable progenitors, N. sylvestris (Nsy) and N. tomentosiformis (Nto). B, Transcript levels of each BBL gene were assessed by RT-PCR in the roots of wild-type (WT) and nic1nic2 mutant (nic) tobacco plants. C to G, Quantitative RT-PCR analysis of BBL genes using BBL-consensus PCR primers. Transcript levels are shown as relative values. C, Organ-specific expression pattern in the wild-type plant and expression level in the nic root. NT, Not detectable. D, Treatment of tobacco roots with 100 μm MeJA for 24 h. E, Treatment of cultured tobacco cells with 50 μm MeJA for the periods indicated. F, BBL transcript levels in cultured tobacco roots of the VC line and two transgenic lines expressing a dominant-negative ERF189 form (ERF189-EAR, D1 and D1; Shoji et al., 2010). G, BBL transcript levels in cultured tobacco roots of the VC line and three transgenic lines overexpressing ERF189 (OE9, OE10, and OE11; Shoji et al., 2010).

