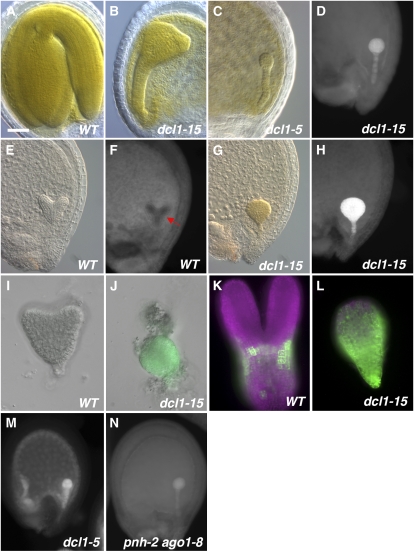
Figure 1.
Phenotypes of miRNA pathway mutants. A to C, Full-size embryos showing the late morphological phenotypes of the wild type (WT; A), dcl1-15 (B), and dcl1-5 (C). D, Chlorophyll autofluorescence in a midglobular stage dcl1-15 embryo. E to H, DIC optics and chlorophyll autofluorescence images of heart stage embryos. Wild-type embryos are white (E), and chlorophyll is starting to accumulate in the protodermis (arrow; F). dcl1-15 embryos at this stage are green (G) and show very strong fluorescence throughout (H). I to L, Expression of pAt2S3:GFP (green; magenta is chlorophyll autofluorescence). I, Wild-type heart stage embryos do not express the reporter. J, dcl1-15 early heart stage embryos show strong expression. K, In wild-type embryos, expression is first clearly observed around the early torpedo stage. L, In dcl1-15, early torpedo stage embryo expression is much higher. M, Chlorophyll autofluorescence in a dcl1-5 late globular embryo. N, pnh-2 ago1-8 embryos show chlorophyll autofluorescence at the late globular stage. Bar = 40 μm (A–H, M, and N) or 20 μm (I–L).

