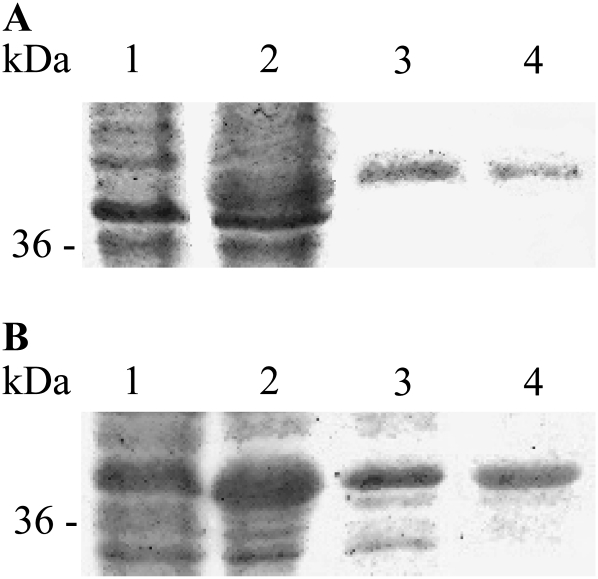
Figure 7.
Purification of E. coli-produced ShMOMT1 (A) and ShMOMT2 (B). Lane 1, noninduced crude extract E. coli cells carrying the ShMOMT1 or ShMOMT2 expression vector but not induced with isopropylthio-β-galactoside; lane 2, induced crude extract; lane 3, the fractions eluting from the DE53 column (A, 2 μg; B, 10 μg) with the highest MOMT activity; lane 4, the fractions eluting from the HiTrap Q column (A, 0.25 μg; B, 5 μg) with the highest MOMT activity. SDS-PAGE results were visualized with Coomassie Brilliant Blue.

