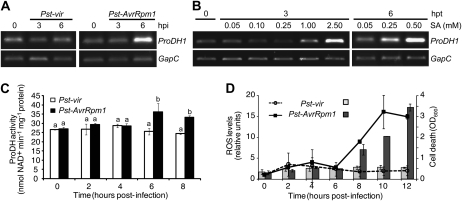
Figure 4.
Activation of ProDH in the HR context. Arabidopsis cultured cells were treated with virulent or avirulent races of Pst (Pst-vir and Pst-AvrRpm1, respectively) as described by Cecchini et al. (2009). In parallel, cultures were treated with the indicated final concentrations of SA. Samples collected from these cultures at the different times post treatment (hpt) were used for the following studies. A and B, ProDH1 expression evaluated as in Figures 1C and 2A. C, ProDH activity in protein extracts from naive and pathogen-treated cultured cells quantified according to Lutts et al. (1999) and Kant et al. (2006). D, ROS and cell death levels, determined by H2DCFDA (lines) and Evans blue staining (bars), respectively, with respect to untreated cells as described by Cecchini et al. (2009). One representative from three independent experiments is shown for each assay. Each experiment included three technical replicates (1-mL aliquot) isolated from treated cultures at each indicated time point. OD, Optical density. In C and D, data represent means ± sd of three replicates. In C, statistically significant differences (P < 0.01, ANOVA) are shown using different lowercase letters.

