
Fig. 3.
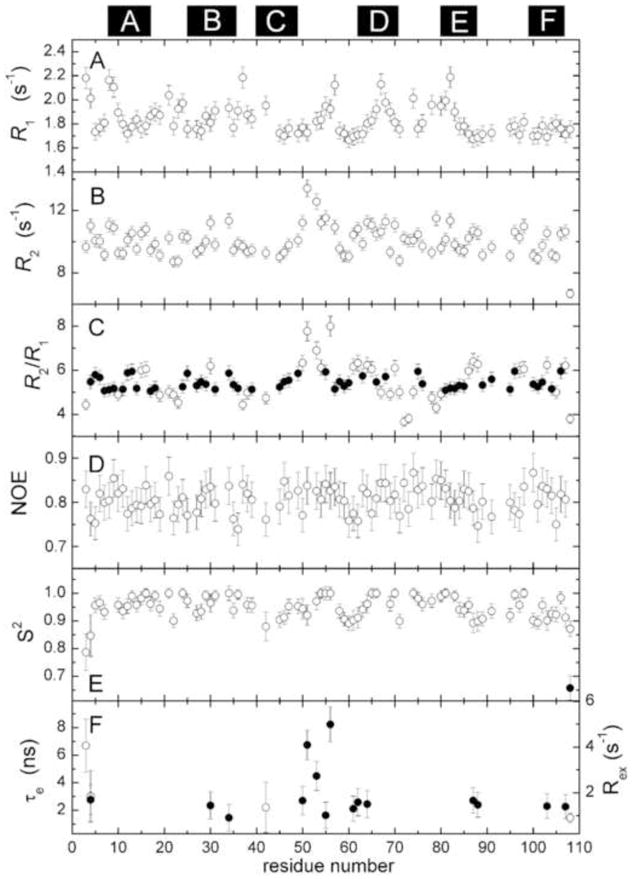
Summary of ATH 15N relaxation data and internal mobility analysis. For reference, the positions of the six helices are indicated at the top of the figure. (A) R1 values. (B) R2 values. (C) Calculated R2/R1 ratios. The filled circles (●) represent amide vectors used in the calculating the mean. (D) {1H}15N NOE values. (E) Order parameter (S2) determined by model-free analysis, as described in the text. Two of the residues required inclusion of a second order parameter (●), corresponding to motion on a slower timescale, to satisfactory model their relaxation behavior. (F) τe (○) and Rex (●) values for residues displaying motion on a timescale exceeding 20 ps.