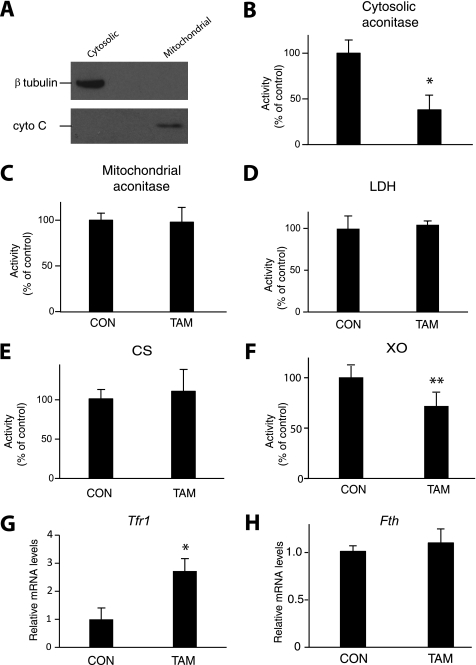
FIGURE 5.
Assay of enzymes and Tfr1 message in extracts following Iop1 deletion in MEFs. Iop1f/f; Rosa26-creERT2 MEFs were treated with either vehicle (ethanol as control (CON)) or 4-hydroxytamoxifen (TAM). A, 3 days later, cytosolic and mitochondrial extracts (10 μg) were analyzed by Western blotting using anti-β-tubulin or anti-cytochrome c antibodies. B–F, activities of cytosolic aconitase (B), mitochondrial aconitase (C), lactate dehydrogenase (LDH) (D), citrate synthase (CS) (E), and xanthine oxidase (XO) (F) were measured (n = 3). * indicates p < 0.01, and ** indicates p < 0.05. G and H, levels of Tfr1 (G) and Fth (H) message were quantitated by real time PCR (n = 3). * indicates p < 0.01. Data are presented as mean ± S.D.

