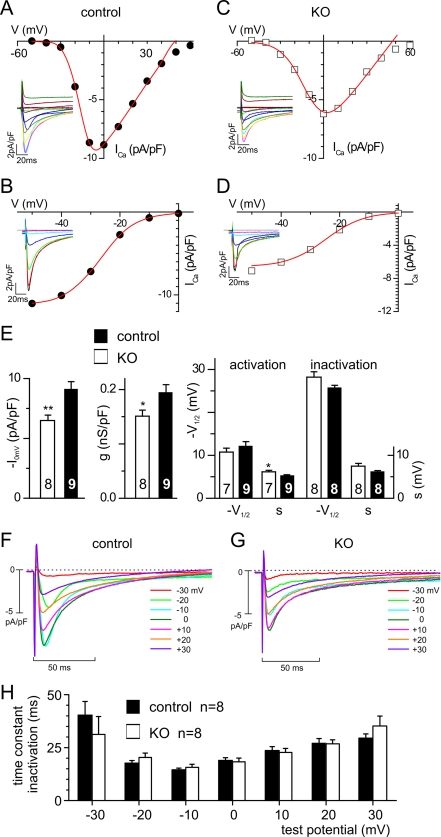
FIGURE 4.
Reduced ICa in adult cardiomyocytes from KO mice. A–G, representative ICa and IV relations (A and C) and inactivation (B and D) in a control (A and B) and KO cardiomyocyte (C and D). E, summary. *, p < 0.05; **, p < 0.005. V indicates test potential (in A and C) and prepotential (in B and D), respectively. F and G, current families (F, controls; G, KO). Holding potential was −100 mV followed by a prestep of 100 ms to −40 mV and the test potentials after the prestep to the indicated voltages. Note that that the first part of all traces is the current at the −40 mV prepotential. H, summary of time constants of inactivation at the indicated potentials obtained from mono-exponential fits from F and G. No significant differences were measured between control and KO mice for all potentials (p > 0.05).

