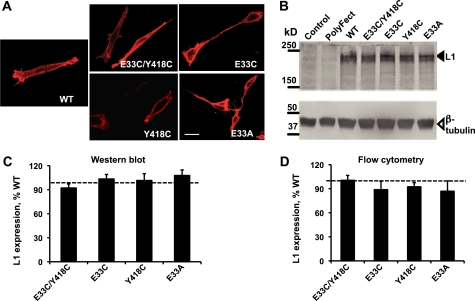
FIGURE 1.
Expression of WT-L1 and mutant-L1. A, immunofluorescence staining of L1 in WT-L1 and mutant L1-expressing NIH/3T3 cells using mAb 5G3. Bar, 50 μm. B, Western blot analysis, using polyclonal antibody SC-1508, of L1 expression in whole cell extracts of NIH/3T3 cells transiently transfected with the indicated L1 constructs. Lanes marked Control and PolyFect are from cells treated without or with the transfection reagent, but without L1 plasmid DNA. Solid arrow, L1; open arrow, β-tubulin. C, quantitative densitometric analysis of Western blots from the experiments described in B. Data shown represent the mean ± S.E. percent of WT-L1 levels for each construct obtained from eight independent experiments. L1 expression was normalized to tubulin expression from the same samples. Expression of the mutant forms of L1 did not differ significantly from expression of WT-L1. D, flow cytometry analysis of cell surface expression of WT-L1 and L1 mutants using mAb 5G3. Geometric means of cells expressing mutant L1 were normalized to values from cells expressing WT-L1 (dotted line in C and D). Data represent the mean ± S.E. from at least four independent experiments.

