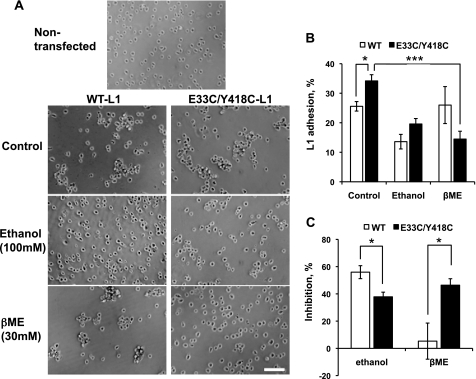
FIGURE 2.
Inhibition of L1 adhesion by ethanol and βME in NIH/3T3 cells expressing WT-L1 and E33C/Y418C-L1. A, number of single and adherent cells was counted from phase contrast micrographs viewed at 100× magnification. Bar, 200 μm. B, L1 adhesion levels in NIH/3T3 cells expressing WT-L1 (open bars) or E33C/Y418C-L1 (solid bars) in the presence or absence of 100 mm ethanol or 30 mm βME. C, percent inhibition of adhesion by ethanol or βME. Data shown represent mean ± S.E., n = 7–21. *, p < 0.01; ***, p < 0.0001.

