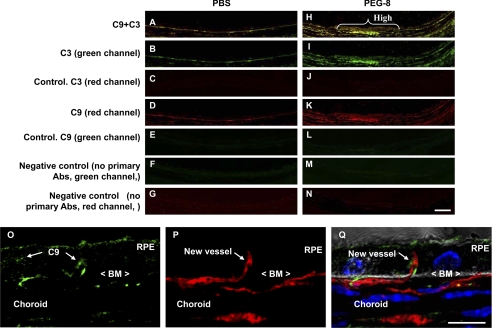
FIGURE 6.
Immunohistochemical staining for C3 and C9 at sites of CNV induction. Microphotographs of PBS-treated (A–G) and PEG-8-treated (H–N) animals (confocal microscopy) show co-localization of C3 and C9 (yellow; A and H), C3 (green; B and I), control for C3 captured using a red channel (red; C and J), C9 (red; D and K), control for C9 captured using a red channel (red; E and L), and negative controls (no primary antibodies) for C3 (green; F and M) and C9 (red; G and N). A high deposition of C9 and C3 (yellow; H, white brace) on the RPE and choroid in PEG-8-treated animals was observed at the sites of penetration of the Bruch's membrane (BM) by endothelial cells (O–Q) at day 1 post-treatment. Scale bars = 20 μm (A–N) and 50 μm (O–Q).

