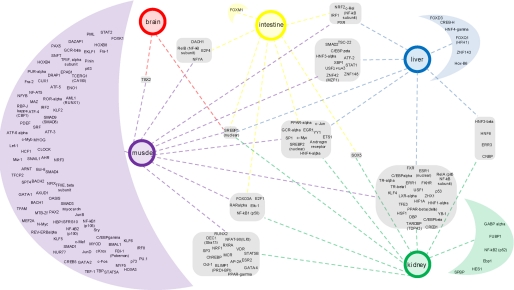
FIGURE 5.
Common and organ-specific transcriptional regulators of the fasting response. Overconnectivity of transcription factors (the nodes of the primary networks of differentially regulated genes) was calculated for each organ using MetaCore Interactome analysis. The resulting network of common and organ-specific regulators was created and visualized in Cytoscape and enhanced in Adobe Illustrator. The tissues are represented with colored circles. Transcription factors, grouped according to the organs for which they are common or specific, are depicted in corresponding rounded squares/half-moons, respectively.

