FIGURE 5.
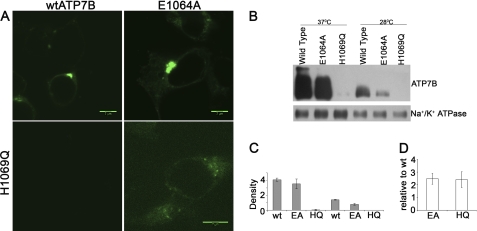
Comparison of intracellular localization, protein, and transcript abundance for the ATP7B mutants. A, HEK293TRex cells were transfected with plasmids expressing GFP-tagged wild-type ATP7B (upper left), the E1064A mutant (upper right), or the ATP7B H1069Q mutant (lower panels). Images for the WT, E1064A, and H1069Q (lower left) were obtained using the same detector gain. Higher detector gain (lower right) was used to visualize the H1069Q mutant. B, microsomal membrane preparations were isolated from cells first transfected with the wild-type ATP7B or mutants at 37 °C and then grown at either 37 °C or 28 °C. Tagged ATP7B was detected using anti-GFP antibody; equal protein loading was verified using anti-Na+,K+-ATPase antibody. A representative Western blot is shown. C, densitometry data are shown for three independent Western blotting experiments. D, total mRNA was isolated from cells transfected with the wild-type (wt) ATP7B or ATP7B mutants, as in A, and the amount of transcripts relative to wild-type mRNA was determined by real-time PCR. The average of three independent experiments is shown.

