FIGURE 3.
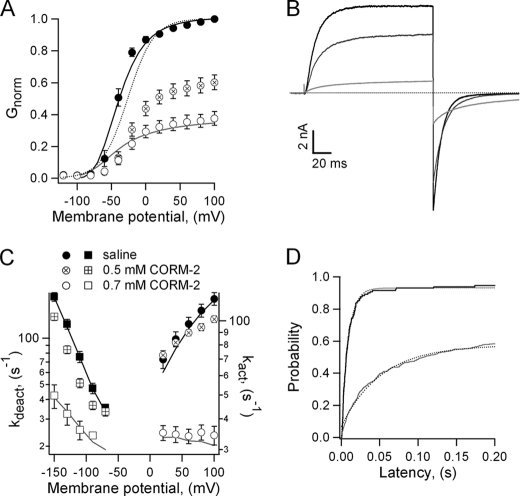
CORM-2 has a small effect on the activation curve and a large effect on channel kinetics. A, G-V curves obtained before (●) or during the application of 0.5 (⊗) or 0.7 (○) mm CORM-2 are shown. Data were fit to Equation 1, and the obtained parameters are: saline, V1/2 = −40 ± 6.1 mV, z = 2.84 ± 0.48 e0; CORM-2 0.5 mm V1/2 = −22.6 ± 2.46 mV, z = 1.66 ± 0.23 e0; 0.7 mm CORM-2, V1/2 = −26.5 ± 4.9 mV, z = 1.67 ± 0.21 e0 (n = 4 - 6). The scaled-up fit to the 0.7 mm CORM-2 data is included as a dotted curve. Solid curves are predictions of the model in Scheme 1, for saline (black), and 0.7 mm CORM-2 (gray). B, representative Kv2.1 currents at 100 mV and deactivated at −130 mV in saline (black traces) and with 0.5 (dark gray) or 0.7 mm CORM-2 (light gray) are shown. The dotted line indicates the zero-current level. C, plots of the activation (circles) and deactivation (squares) rate constants obtained from single-exponential fits to traces as in B at several voltages and at both CORM-2 concentrations. Data were fit to Equation 4, and the resultant values are: saline, kact(0) = 64.3 ± 5 s−1, zact = 0.18 ± 0.01 e0, kdeact(0) = 7.59 ± 1 s−1, zdeact = −0.57 ± 0.03 e0; 0.5 mm CORM-2, kact(0) = 74.0 ± 13.0 s−1, zact = 0.17 ± 0.01 e0, kdeact(0) = 6.28 ± 1 s−1, zdeact = −0.53 ± 0.02 e0; 0.7 mm CORM-2, kact (0) = 38.4 ± 6.4 s−1, zact = 0.0004 ± 0.0076 e0, kdeact(0) = 5.40 ± 0.45 s−1, zdeact = −0.29 ± 0.04 e0 (n = 4 - 25). Solid curves were calculated from the model in Scheme 1 for saline (black) and 0.7 mm CORM-2 (gray). D, shown is representative probability versus first latency plot obtained from single-channel recordings as in Fig. 1D in the absence (black trace) or presence (gray trace) of 0.5 mm CORM-2 at 100 mV. Dotted curves are fits to an exponential function. The rates are: ksal = 103 ± 18 s−1, kcorm = 23 ± 4 s−1 (n = 2).

