FIGURE 4.
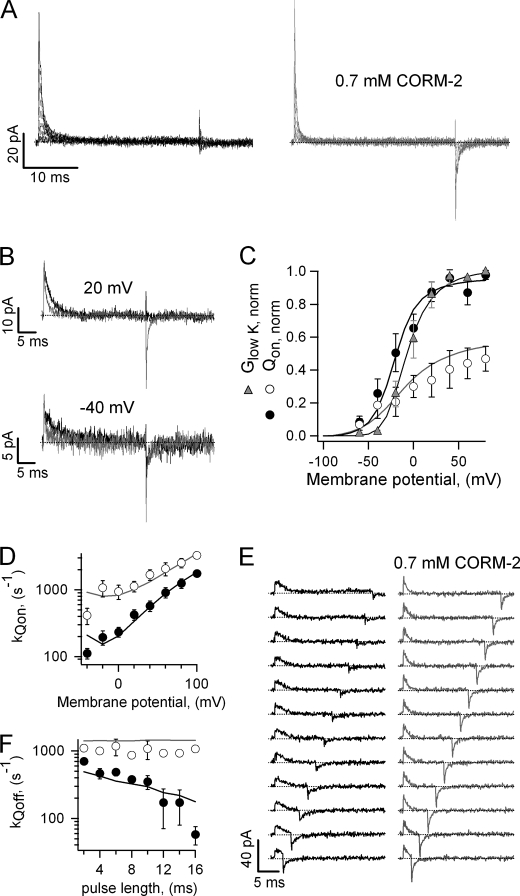
CORM-2 and charge movement in Kv2.1. A, shown are representative Kv2.1 gating current families from the same patch, activated by voltage pulses between −60 and 80 mV in 20-mV increments with or without CORM-2. B, shown is a comparison of gating current traces from A at 20 and −40 mV in the presence (gray traces) and absence (black traces) of CORM-2. C, shown is a normalized Qon-V curve obtained either before (filled symbols) or in the presence (empty symbols) of CORM-2. Data were fit to the Boltzmann equation, and the obtained fits are: saline, V1/2 = −21.3 ± 6.1 mV, z = 1.82 ± 0.13 e0; CORM-2, V1/2 = 8.43 ± 20.56 mV, z = 0.91 ± 0.18 e0 (n = 6). The normalized G-V curve was obtained under the same ionic conditions as the gating currents with 5 mm extracellular KCl. A fit to Equation 1 gave the following parameters: V1/2 = −3.37 ± 5.76 mV, z = 2.84 ± 0.30 e0 (n = 9). Solid black and gray curves are the model predictions for saline and CORM-2, respectively. D, shown are gating current decay rate constants measured from traces as in A in the presence (empty symbols) and absence (filled symbols) of CORM-2. The parameters of the fit to Equation 4 are: saline, kQon(0) = 284 ± 57 s−1, zQon = 0.47 ± 0.03 e0, CORM-2, kQon(0) = 1033 ± 224 s−1, zQon = 0.27 ± 0.03 e0 (n = 6). Solid curves are the rates predicted by the model. E, representative gating currents were elicited by successive pulses to 40 mV of increasing duration. Dotted lines mark the zero-current level. F, off-gating current rate constants were obtained from traces as in E as a function of depolarizing pulse duration. Solid curves are the model predictions.

