FIGURE 6.
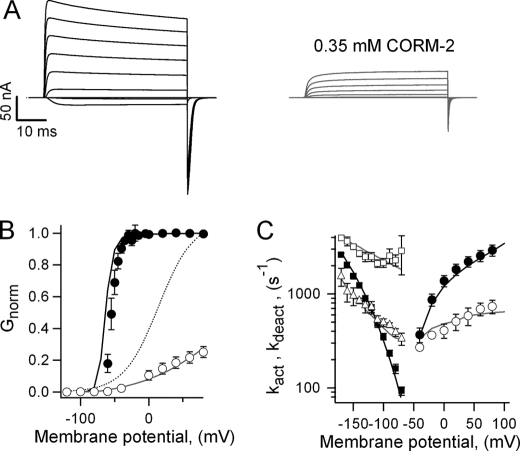
Shaker channels are also inhibited by CORM-2. A, Shaker WT ionic current families activated by voltage pulses from −120 to 80 mV in 20-mV increments were obtained in saline and in CORM-2. B, normalized G-V curves from traces as in A are shown, with closed circles for saline and open circles for CORM-2. The parameters obtained from fits to Equation 1 were: saline, V1/2 = −39.6 ± 3.1 mV, z = 4.86 ± 0.3 e0; CORM-2, V1/2 = +19.4 ± 8.5 mV, z = 0.99 ± 0.10 e0 (n = 4). The dotted curve is a scaled fit of Equation 1 to the CORM-2-data. Solid curves are predictions from Scheme 1 for saline (black) and CORM-2 (gray). C, activation (circles) and deactivation rate constants (squares and triangles) for Shaker in saline (filled symbols) and in 0.35 mm CORM-2 (empty symbols) are shown. Data were fit to Equation 4, and the resultant values were: saline, kact (0) = 1298 ± 166 s−1, zact = 0.25 ± 0.01 e0, kdeact (0) = 24.5 ± 4.1 s−1, zdeact = −0.70 ± 0.02 e0; CORM-2, kact (0) = 412 ± 64 s−1, zact = 0.175 ± 0.004 e0, kdeact1 (0) = 1124 ± 242 s−1, zdeact1 = −0.19 ± 0.04 e0, kdeact2 (0) = 179 ± 31 s−1, zdeact2 = −0.28 ± 0.05 e0 (n = 4 - 6). Solid curves are the predictions of Scheme 1.

