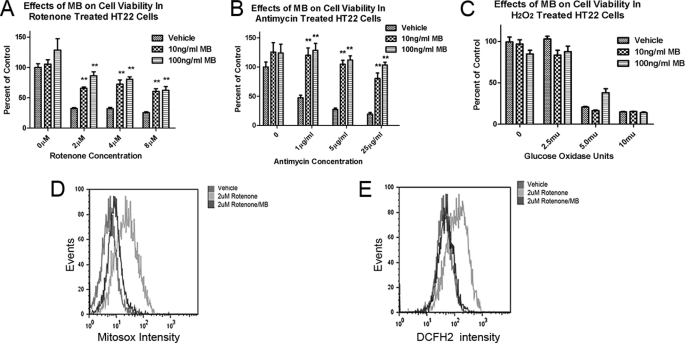
FIGURE 4.
Effects of MB in rotenone- and antimycin A-induced mitochondrial dysfunction and cell death. A and B, neuroprotective effect of MB on rotenone-induced (A) and antimycin A-induced (B) cytotoxicity in HT22 cells. **, significant difference from vehicle. C, MB has no protection against H2O2 (released by glucose oxidase)-induced cytotoxicity. D and E, effects of MB on rotenone induced mitochondrial specific superoxide (D) and total cellular ROS (E). The y axis depicts the event (cell number in count × 103), and the x axis depicts fluorescent intensity. Shown is the representative result from three independent sets of experiments. Error bars, S.E.

