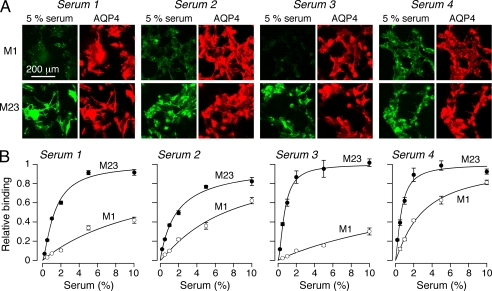
FIGURE 3.
Differential binding of NMO-IgG in NMO patient serum to M1 versus M23 AQP4. A, M1- and M23-expressing U87MG cells stained with 5% NMO serum (green) from four patients and with reference AQP4 antibody (red). B, binding curves for the NMO patient sera to M1 versus M23 AQP4 (mean ± S.E. (error bars), n = 5). Curves represent fits to single-site binding model.

