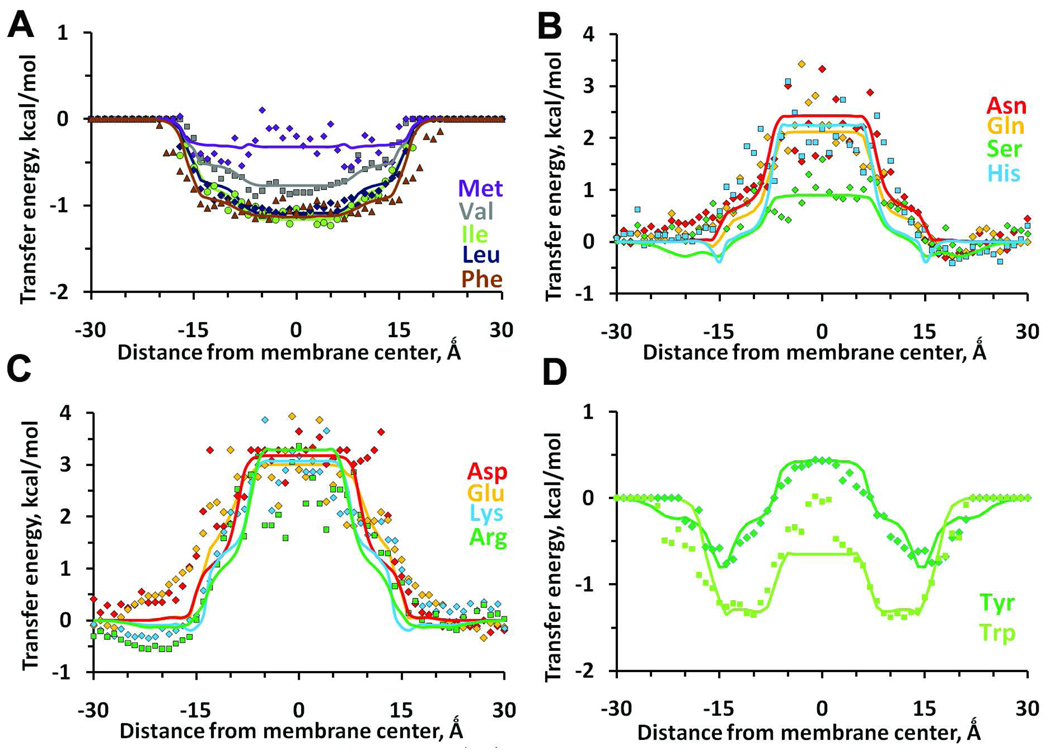
Figure 5.
Comparison of transfer energies calculated for 15 amino acid residues in α-helix after optimization of parameters for water (solid lines) and statistical energies (squares, circles, triangles and diamonds) obtained for solvent-exposed residues in a set of 119 α-helical transmembrane proteins from bacterial, archaeal, and eukaryotic membranes from the OPM database. The calculated energies were normalized to account for the difference of ASA for the residue in the set of proteins and in isolated α-helix.

