Figure 1.


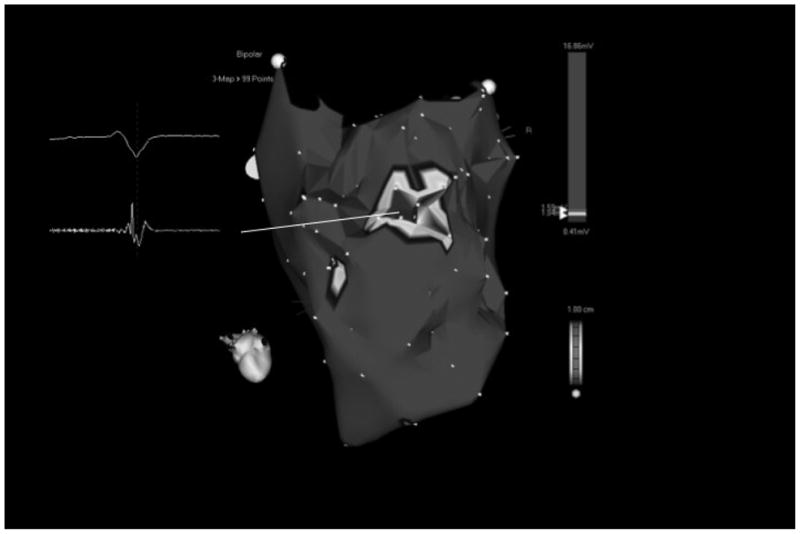
Figure 1 a - Voltage map of the posterior left ventricle in a patient with prior inferior wall infarction without inducible VT. There is a localized area of low voltage that corresponds to the area of delayed enhancement in Figure 1b. The endocardial low voltage area was 4.8 cm2 as measured by electroanatomical mapping. This patient did not display any isolated potentials during sinus rhythm. The insert shows a non-fractionated abnormal electrogram within the scar tissue. Mitral valve annulus (MVA) and left ventricular apex (apex) are indicated.
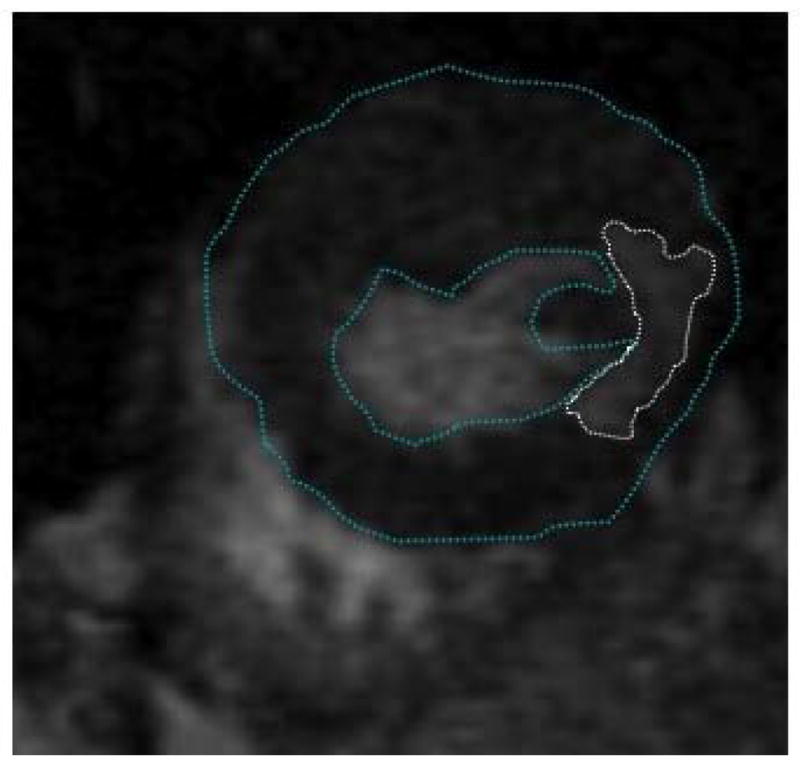
Figure 1b - Short-axis delayed enhanced magnetic resonance image of the mid left ventricle in the same patient shown in Figure 1a. There is delayed enhancement in the posteroseptal left ventricle (encircled with dotted line). The endocardial and epicardial borders were manually traced (blue colored lines). Infarct volume was 7.6 cm3 and the infarct percentage was 9%.
