
Figure 2.

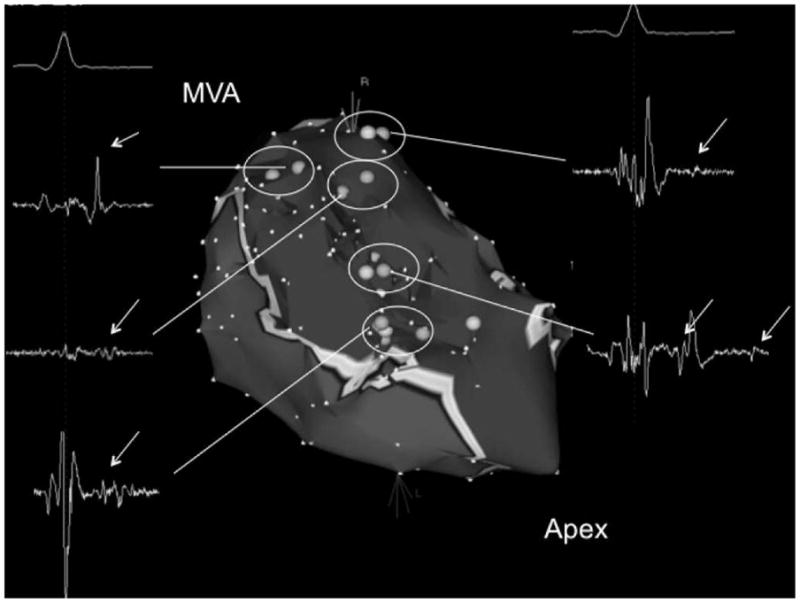
Figure 2a - Voltage map of the posteroseptal aspect of the left ventricle in a patient with extensive inferoseptal wall infarction in whom 8 different VTs were induced. Areas in red indicate subendocardial scar (voltage <1.0mV). Scar area as assessed by electroanatomic mapping was 57 cm2. Light blue tags indicate sites of isolated potentials. The inserts display the local electrograms at these sites. Isolated potentials are indicated with white arrows. There were 5 distinct sites where isolated potentials were identified (circles). Different critical VT isthmuses were identified at 3/5 sites displaying an isolated potential. The pink tags indicate isthmus sites that were identified during the ablation procedure. The mitral valve annulus (MVA) and left ventricular apex (apex) are indicated.
Figure 2b - Left panel: Short-axis delayed enhanced magnetic resonance image of the left ventricle in the same patient shown in Figure 2a. There is delayed enhancement in the inferoseptal left ventricular wall (encircled with a dotted line). Epicardial and endocardial borders are traced with a blue line. Right panel: Long-axis view of the delayed enhanced magnetic resonance image in the same patient. This shows that the scar extends from the mitral valve annulus to the left ventricular apex. The infarct volume was 27.2 cm3 and the infarct percentage was 27%.