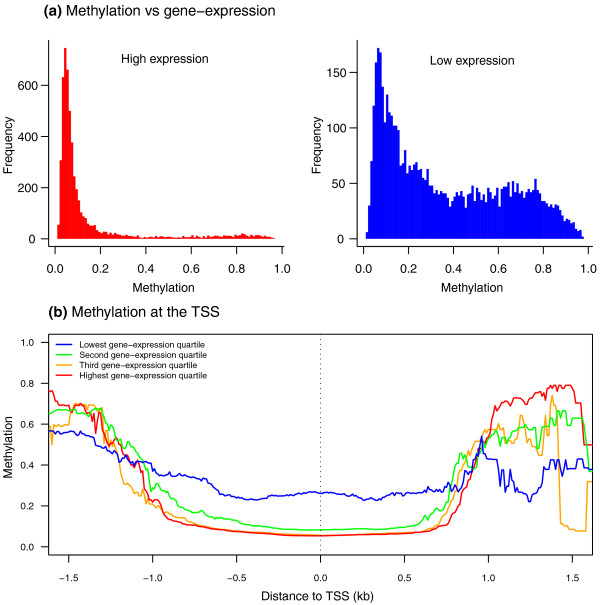
Figure 2.
DNA methylation is negatively correlated with gene expression. (a) Methylation levels are low in the top quartile of highly expressed genes (left), and high in the bottom quartile of lowly expressed genes (right), looking across 12,670 autosomal genes. (b) Methylation levels with respect to the TSS in sets of genes categorized by gene expression levels, from highest (red) to lowest (blue), using the quartiles of gene expression with respect to gene expression means, where fitted lines represent running median levels (see Figure 1b).

