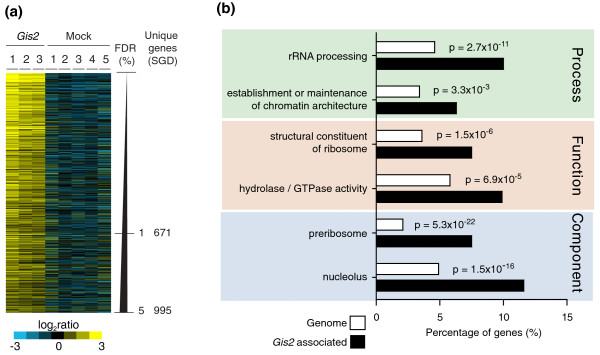
Figure 1.
RNAs specifically associated with yeast Gis2p. (a) Color map of Gis2p-associated transcripts (FDR <5%). Rows represent unique transcripts ordered according to decreasing FDRs. Columns correspond to individual experiments. Relative enrichment of genes in the individual RNA affinity isolations is shown in the blue-yellow ratio scale. (b) A selective sample of significantly shared GO terms among Gis2p-associated transcripts with a FDR <5%. SGD, Saccharomyces Genome Database.

