Figure 2.
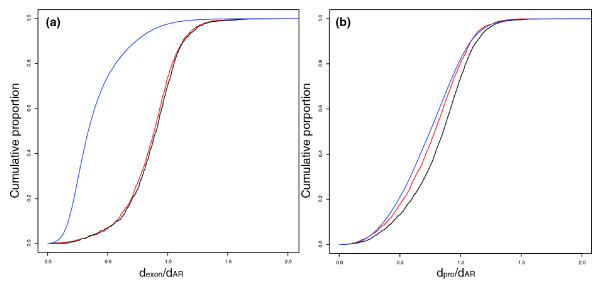
Substitution rates of ncRNA and protein-coding genes. The cumulative distributions of substitution rate for (a) exons and (b) promoters as measured for macroRNAs (red), lincRNAs (black) and protein-coding genes (blue). MacroRNA and lincRNA exons exhibit similar degrees of constraint and appear to evolve faster than protein-coding exons. Protein-coding gene promoters evolve under stronger constraint than ncRNA exons. MacroRNA promoters have lower substitution rates than lincRNA promoters.

