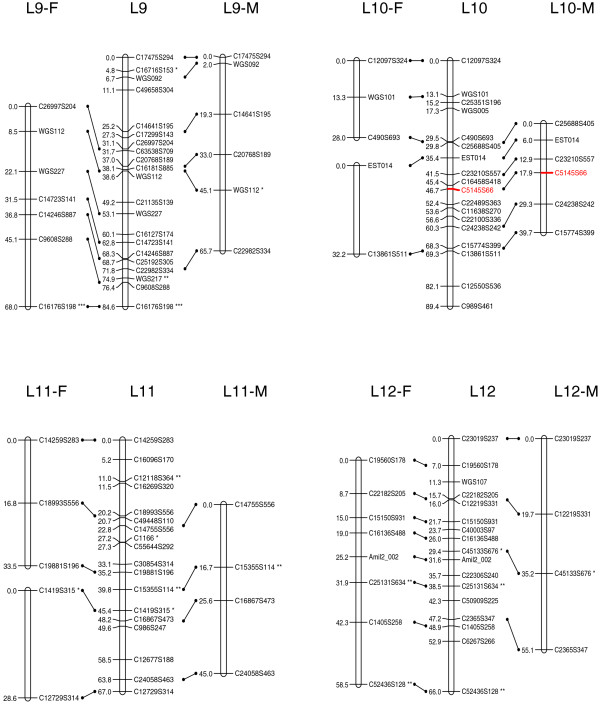
Figure 3.
A genetic linkage map (L9 to L12) of the reef-building coral A. millepora. Female (F) and male (M) maps are shown on the left and right, respectively, and the consensus map is shown in the center. Homologous loci are connected with solid lines. Putative stress-related markers are shown in red. Distorted loci are indicated by asterisks (*0.01 <P < 0.05, ** P < 0.01; *** P < 0.001).

