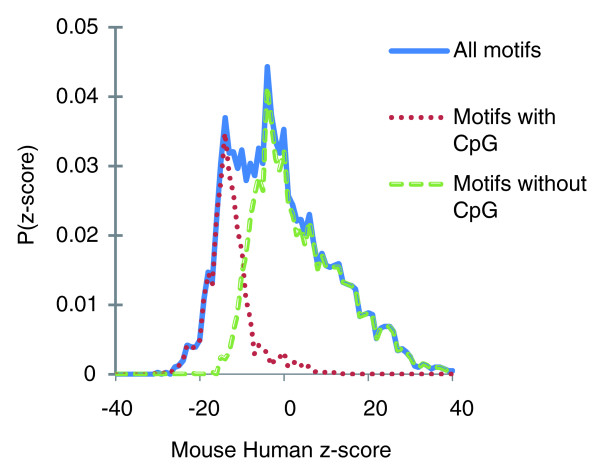
Figure 2.
Distribution of mouse-human COMIT z-scores. Motifs containing CpGs have systematically lower conservation scores (dotted red curve, mean = -12.8), while the remaining motifs have higher conservation scores (dashed green curve, mean = 5.2), consistent with hypermutability of CpG dinucleotides in mammalian genomes. The non-CpG distribution has an excess of motifs with high z-scores, as can be seen from the long rightward tail. This suggests that selection has acted to maintain sequence conservation of these motifs across species.

