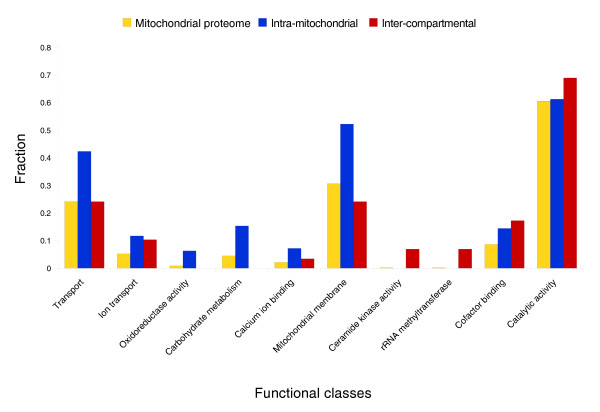
Figure 1.
Contribution of different duplication types to the function of the mitochondria. Classes significantly overrepresented compared to the mitochondrial proteome are shown. The height of a bar represents the fraction of proteins that is annotated with a specific category. Three datasets are shown: the whole mitochondrial proteome (MitoCarta proteins [4]; yellow), intra-mitochondrial (blue) and inter-compartmental (red) duplications. Protein functional classes are defined by GO functional classification [68]. Benjamini and Hochberg false discovery rate correction was used to derive statistically significant categories. See Tables S5 and S7 in Additional data file 1 for the full list.

