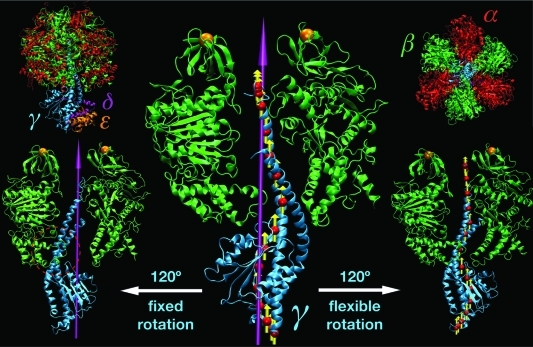
Figure 4.
F1-ATPase structure. In the upper left (right) corners, the full protein structure (α3β3δε) is shown in a side (top) view. Subunit color-coding is α, red; β, green; γ, cyan; δ, magenta; and ε, orange. The central panel illustrates the initial orientation of the rotor domain (γδε) with respect to the stator (α3β3); for the sake of simplicity, only the γ and two β subunits are shown. The 3-fold symmetry axis of α3β3 that was used as a rotation axis in Viso is shown in magenta. The red spheres and yellow arrows depict slab centers and local rotation axes as used by the flexible potentials. The left and right side panels show the orientation of the rotor after 120° of enforced rotation using Viso and Vflex2, respectively. The two orange spheres denote harmonic restraints applied to the N-terminal tags of the β subunits. This is to prevent co-rotation of the α3β3 stator in close resemblance to single-molecule force probe experiments, in which the stator is immobilized by attaching the protein to the surface via His tags attached to one subunit type (usually the β chains). Figure prepared with VMD.(38)

