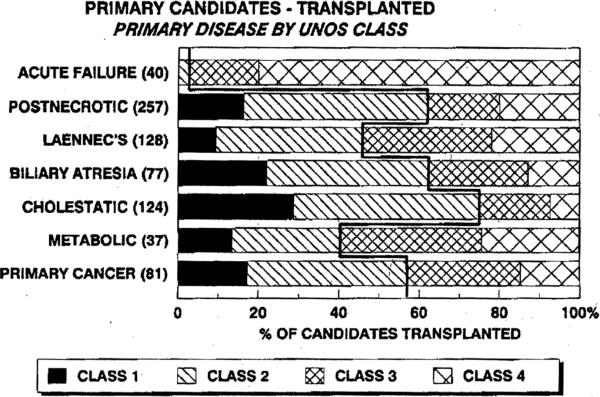
Figure 3.
The proportion of candidates for a first liver graft in each UN OS class of medical urgency at the time of transplantation according to primary liver disease. The meandering bold line separates the proportion of patients in higher-risk groups (classes 3 and 4) from those in moderate- (class 2) and low-risk groups (class 1). The further the line shifts to the left, the higher the proportion of patients in classes 3 and 4.

