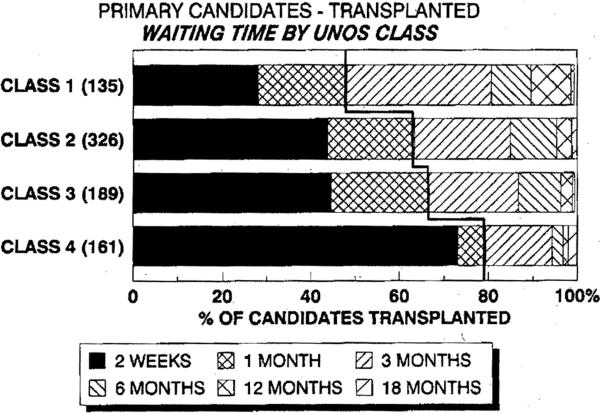
Figure 4.
The proportion of candidates who received a primary paft within specified intervals according to-UNOS class (medical priority). The meandering bold line separates the proportion of patients in higher-risk groups (classes 3 and 4) from those in moderate- (class 2) and low-risk (class 1) groups. The further the line shifts to the left, the higher the proportion of patients in classes 3 and 4.

