
Figure 3.
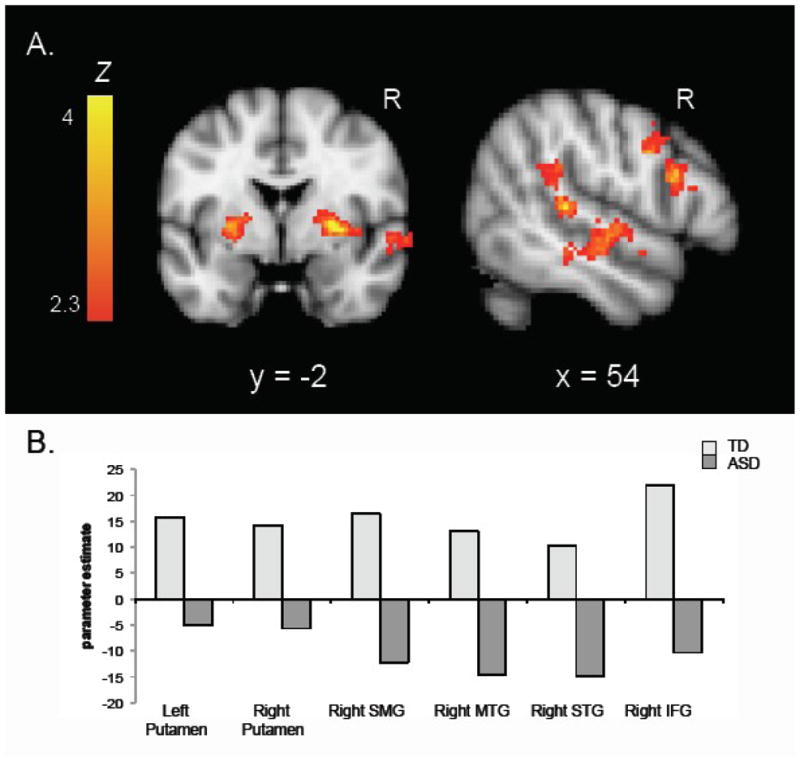
A. Z statistic activation maps of the 2 (TD vs. ASD) × 2 (Directional Gaze vs. Directional Arrow) interaction (corrected for multiple comparisons at the cluster level, p < .05). Color barsindicate Z statistic. Coronal slice shows activity in bilateral putamen and right STS; sagittal slice shows activity in right STS and IFG. B. Parameter estimates for the directional gaze > directional arrow contrast for each group in regions shown in A.